


 sales@sunriver-electric.com
Observation: Top commercial installers sell cash-flow, not kilowatts.
The Silent Deal-Killer
You present a flawless 100 kW design—perfect layout, 40 % bill savings.
The owner’s only question: “What’s the payback?”
Conversation stalls. Root cause: kilowatts ≠ profit margins.
The Fix: A 3-Line ROI Snapshot
- Initial Outlay → CAPEX
- Annual Cash Flow → (Energy savings + incentives – O&M)
- Payback & IRR → 3.8 yr / 18 % IRR
Plug these three numbers into any proposal and the dialogue shifts from cost to return.
What’s Next
This guide walks you through the exact worksheet to generate those three lines for any commercial project—no finance degree required.
What is Solar ROI? (And Why It’s Your Most Powerful Sales Tool)
To effectively sell a commercial solar project, you must first frame it correctly. This means moving the conversation away from technical jargon and into the language of business finance. The key to this is understanding and explaining Return on Investment (ROI).
From "Cost" to "Investment"
Think about the last time you bought a major tool for your own business. You didn’t see it as a "cost," but as an "investment" in your efficiency and profitability. That’s exactly how a business owner views a solar project.
| Mindset Shift | What the Owner Hears |
|---|---|
| “System cost: $120 k” | Expense |
| “5-year payback, 18 % IRR” | Asset |
For a business owner, ROI is the universal language of financial performance. It answers the client’s core question: "Is this a good use of my company’s money?" When you can answer that question with a clear, confident number, you stop being a contractor and become a trusted financial partner.
Case in point: A six-figure factory deal was lost on panel degradation talk. The winner simply showed a 5-year payback—project signed the next day.
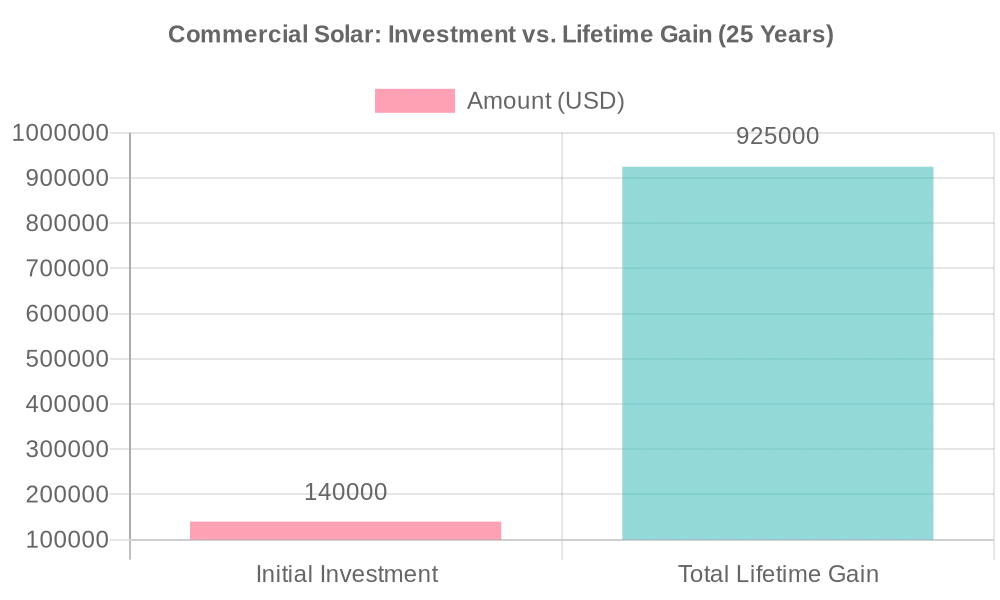
Chart 1: Commercial Solar Investment vs. Lifetime Gain
The Two Formulas You Absolutely Need to Know
Don’t worry, this isn’t complex math. To become fluent in the language of ROI, you only need two simple formulas. Let’s put them on the table right now.
The Simple Payback Period Formula
This is often the most powerful number for a client. It answers, "How long until this system pays for itself?"
Payback Period (Years) = Total Investment Cost / Annual Financial GainThe Simple ROI Formula
This formula gives the big-picture view of the project’s total profitability over its lifetime.
ROI (%) = (Total Net Gain / Total Investment Cost) x 100%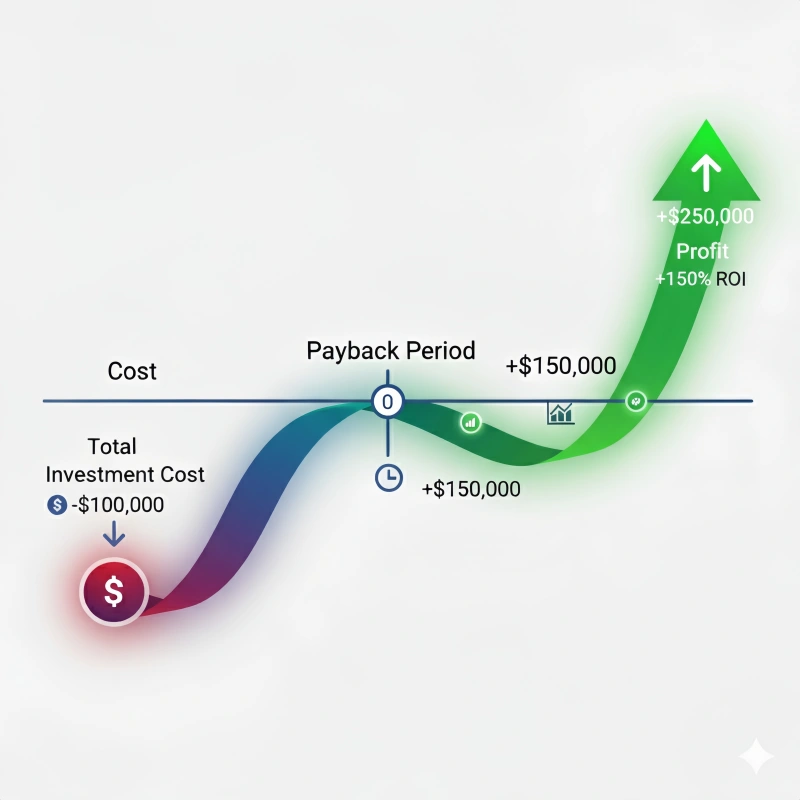
Step 1: Calculating the Total Upfront Investment (Your ‘I’)
This is the first piece of the puzzle. It’s not just the sticker price of the system; it’s the real cost to the business after the most powerful solar incentive is applied.
Start with Your Turnkey Price
This is the total cost for the hardware, labor, and all associated "soft costs" like permitting and inspection fees. For a realistic example, we’ll use a citable industry average of $2.00 per watt.
The Game-Changer: The Federal ITC1
Here’s where the magic happens. The Investment Tax Credit (ITC) is a dollar-for-dollar credit against the business’s federal tax liability.
The ITC is not a deduction; it’s a direct discount on the cost of the system, paid for by the federal government. For systems installed now, it’s a full 30% of the total system cost, a fact backed by the Solar Energy Industries Association (SEIA).
This is the most critical number to get right. It instantly transforms the financial picture of the project.
| Line Item | Amount | Notes |
|---|---|---|
| Total System Cost | $200,000 | Based on a 100kW system at $2.00/watt. |
| Federal ITC1 (30%) | -$60,000 | Data from SEIA. |
| Total Investment Cost (‘I’) | $140,000 | The real cost after the tax credit. |
Step 2: Calculating the Annual Financial Gain (Your ‘G’)
This is where you show the client how the system doesn’t just sit on their roof; it actively makes them money every single year. For commercial clients, this is about much more than just lower electricity bills.
The Hidden Giant: Demand Charge Reduction
Have you ever looked at a commercial utility bill and seen that huge "demand charge"? For many businesses, it can be over 50% of their total bill. It’s a fee based on their single highest peak of energy use.
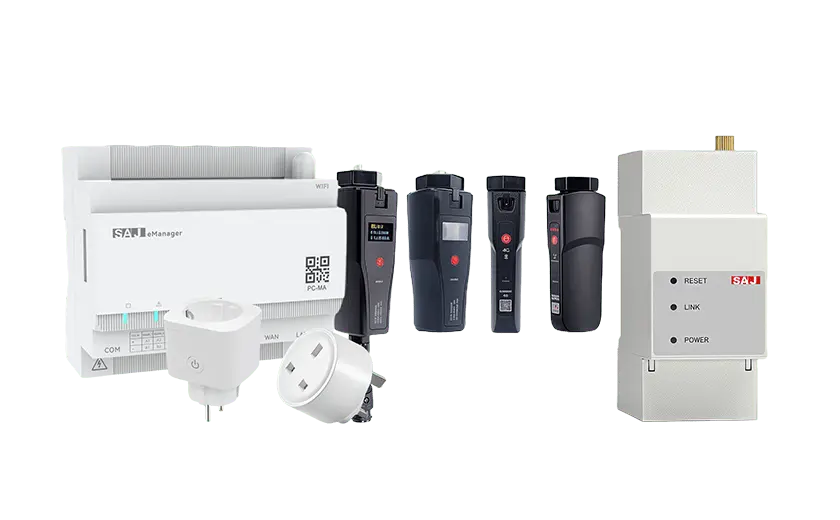
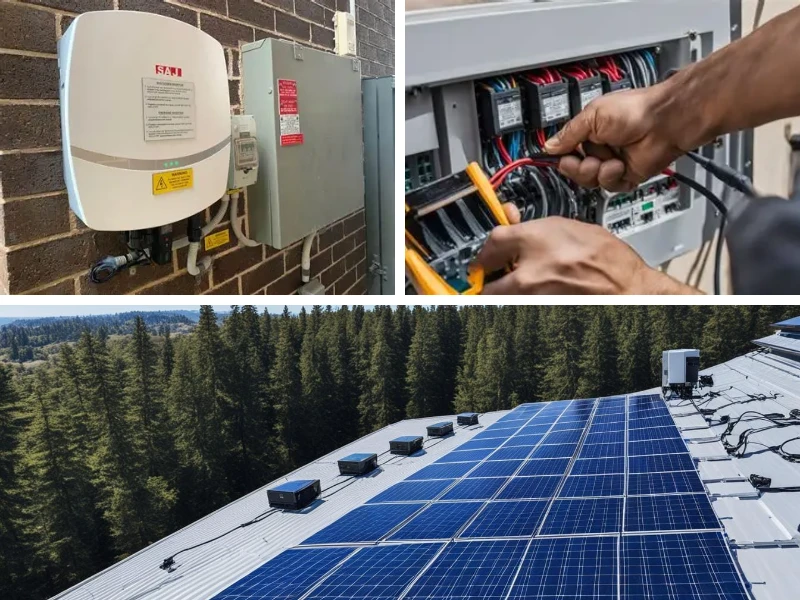
This is arguably the most compelling financial argument for a C&I energy storage system, like the Sunriver Electric SAJ C&I series. A solar and storage system can be programmed to deploy battery power during these peaks, effectively "shaving" them and slashing the highest single cost on the client’s bill.
Chart 2: Typical C&I Electricity Bill Composition

The Obvious Win: Electricity Bill Savings
This is the easiest part to explain. The system generates free, clean energy, so the client buys less from the utility. Simple as that.
The Accountant’s Favorite: MACRS Depreciation2
Here’s a benefit that will make your client’s accountant smile. The IRS allows businesses to depreciate the cost of their solar assets over a 5-year accelerated schedule. This creates a significant tax deduction that reduces their overall tax burden.
- Calculate Annual kWh Savings
- Calculate Annual Demand Charge Savings
- Calculate Tax Benefit from MACRS Depreciation2
- Subtract Annual O&M Costs (a conservative 0.5% of total cost)
Step 3: Let’s Do the Math (A Real-World Example)
Now, let’s put it all together. Let’s go back to our client, Sarah, who owns a warehouse and is looking at a $200,000 (100kW) system.
First, what’s her real investment?
- Total System Cost: $200,000
- 30% Federal ITC1: -$60,000
- Total Investment (‘I’): $140,000
Next, what’s her annual gain?
- Electricity & Demand Charge Savings: +$30,000
- MACRS Tax Benefit (Avg. per year): +$8,000
- O&M Costs: -$1,000
- Annual Financial Gain (‘G’): $37,000
The Final Calculation
Now we can finally answer her two most important questions.
"How long until this pays for itself?"
$140,000 (I) / $37,000 (G) = **3.78 Years**"What’s my total return?" (Calculated over 25 years)
Total Net Gain = ($37,000 * 25) - $140,000 = $785,000
ROI = ($785,000 / $140,000) x 100% = **560%**
What is a "Good" ROI? (And How to Set Expectations)
So you’ve presented the numbers, and they look great. But the client asks, "Is that good?" This is your chance to build even more trust by providing honest, credible context.
The Industry Benchmark: Focus on the 3-7 Year Payback
Instead of focusing on the huge ROI percentage, which can sometimes feel unbelievable, ground the conversation in the payback period. In the commercial solar industry, a payback period in the 3-7 year range is widely considered a fantastic investment. A payback under 5 years is a home run.
This isn’t just an opinion; it’s a benchmark you can confidently share. It shows that Sarah’s 3.78-year payback is an exceptional result.
How Solar Stacks Up
It’s powerful to compare solar to other business investments.
- New Machinery: Often has a payback period of 7-10 years.
- Stock Market: The historical average implies a 10-year payback, with far more risk.
A solar project is one of the most predictable and resilient investments a business can make.
| Investment | Typical Payback Period | Risk Level |
|---|---|---|
| Commercial Solar | 3-7 Years | Baixo |
| New Industrial Machinery | 7-10 Years | Medium |
| Stock Market (S&P 500) | 10+ Years | High |
Beyond ROI: Other Financial Metrics to Mention
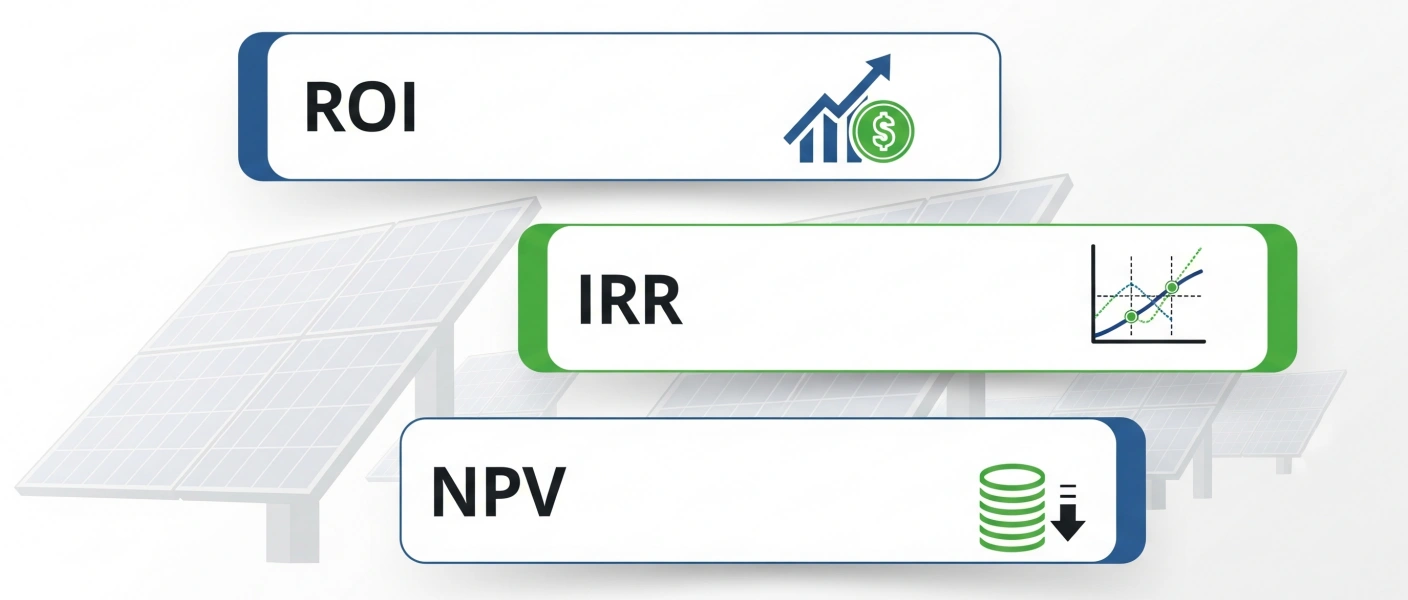
To solidify your position as an expert, it helps to be familiar with other financial terms. This section provides simple definitions for IRR and NPV, equipping you to handle more sophisticated financial conversations and reinforcing your role as a knowledgeable consultant.
| Metric | One-Line Definition | Typical Solar Benchmark | When to Use |
|---|---|---|---|
| ROI | How fast the money comes back. | 3–6 yr payback | Opening pitch |
| IRR | Annualized profit rate. | 12–18 % | CFO asks “What’s the yield?” |
| NPV | Lifetime profit in today’s dollars. | > $0 (positive) | Accountant wants “real value” |
These three numbers turn a technical quote into a board-ready investment summary.
Think of it this way: NPV answers the question, "If we account for inflation and the cost of capital, how much money will this project realmente make us over its lifetime in today’s dollars?" A positive number is a clear signal of a sound investment.
Conclusion: You’re Not a Contractor, You’re a Financial Partner
The next time you walk into a meeting with a business owner, you’re not just carrying a technical proposal. You’re carrying a financial plan. By learning to speak the language of ROI, you can clearly demonstrate how a solar project isn’t a cost—it’s one of the most powerful investments they can make in their company’s future.
Disclaimer: This guide provides a framework for understanding the financial benefits of a commercial solar system. The calculations and examples are for illustrative purposes only. Always advise your clients to consult with a qualified tax professional to understand how these benefits apply to their specific financial situation.